Damp, mould and preventing condensation in your home – find out more

We have an ambitious strategic plan called ‘Making the Difference’. This sets out how we aim to build a customer-focused organisation which offers good value for money and provides even more services to you in the future.

We are investing in a major digital transformation programme called Better Connected which will make it easier and quicker for you to access our services.

We are also investing heavily in your homes and in our staff, with the aim of being the best landlord possible.

Based on this vision, we have set out six key areas where we are measuring how well we are doing year-to-date (April 2022 – March 2023).

Area Overall customer satisfaction (year-to-date)
Our customers value our services
  • Customer Net Promoter Score – 27
  • Overall customer satisfaction with repairs service – 82%
  • Satisfaction with value for money for rent – 84%
Our customers trust us
  • Satisfaction with views listened to and acted upon – 77%
  • Trust us to do what is right – 75%
  • Satisfaction with complaints resolution (Housing Ombudsman code) – 56%
Our services are easy to use
  • The MyRaven portal is easy to use – 89%
  • Customer online transactions –


Area Return on capital employed
Providing more homes
  • Net new homes delivered (cumulative from April 2022) – 160
  • New leased and managed properties (cumulative from April 2022) – 137
Customer Overall customer satisfaction (year-to-date)
Homes are high quality, sustainable and affordable
  • Satisfaction with your home – 79%
  • Number of complaints/defects related to repairs/quality of home –
  • Satisfaction with new home (lettings survey) – 76%


Financial Return on capital employed
Homes are high quality, sustainable and affordable
  • Proportion of homes meeting EPC C standard – 80%


Area Overall customer satisfaction (year-to-date)
We develop resilient communities
  • Satisfaction with the neighbourhood as a place to live – 85%
  • Number of ASB/dispute cases –
  • Satisfaction with outcome of ASB/dispute cases – 72%
  • Evictions (divided by ASB/rent) – 11
  • Affordability of bills and credit commitments rent  – 37%
  • Number of complaints per 1,000 tenancies –
  • Social Return on Investment – 1:14
Area Return on capital employed
Improving value for money
  • Current tenant arrears – 2.67%
  • Operating cost per unit – £
  • EBITDA (operating surplus) – £
  • Surplus from activities other than social housing (% of total surplus) – 
  • Housing sales income (shared ownership & private) – £
Area Employee engagement  
Creating better together
  • IiP (Investors in People) accreditation – Gold
  • Staff feel leaders value different perspectives – 70%
  • Staff feel comfortable being themselves at work – 83%

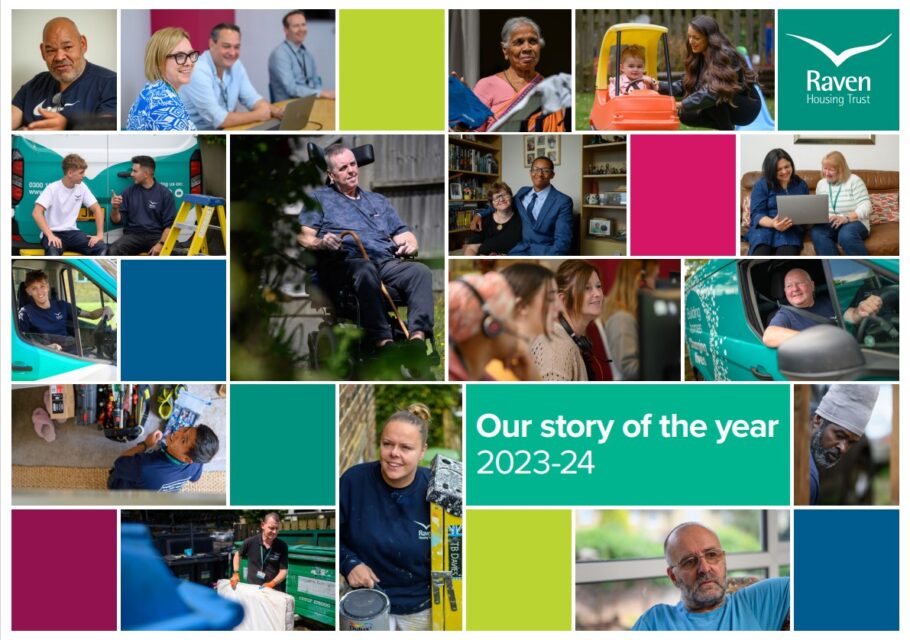
Our customer annual report

As part of our commitment to being open, transparent, and building on our value of trust, we produce a customer annual report each year.

This shows how we’re doing as an organisation, working towards our purpose of Building Homes, Changing Lives. It includes a breakdown of how your rent is spent, how we look after your home and the extra support we provide.

For the financial year 2022-23, we’ve created a video as a snapshot of the report, which we hope you’ll find useful.

If you’d like to read the full report, you can here.

Cookie Settings