Staff diversity data
We’re committed to being an inclusive company with a diverse workforce and equal opportunities. In line with this, we encourage our employees to provide us with information about themselves that we use to gain insight into the characteristics of our workforce, compare this with the customers and communities we work with, and target our equality, diversity, and inclusion initiatives accordingly.
Diversity data
As part of our commitment to diversity and to ensure transparency, we publish our workforce diversity data in comparison to our own customers and to the wider local authority population in which we provide housing and services.
This data is correct as of 21st September 2022.
Gender:
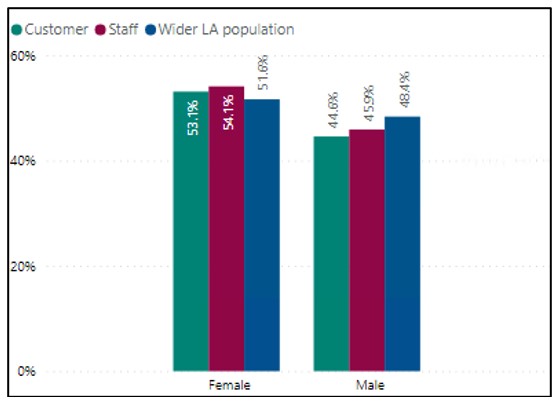
The gender mix of our workforce is representative of our customer and wider local authority (LA) population; as well as having an even balance between female and male employees.
Age:
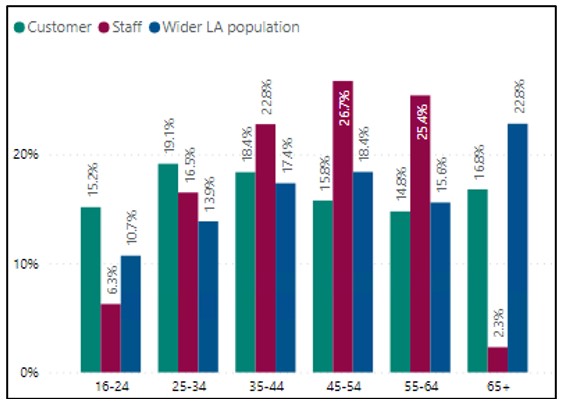
The largest percentage of our employees are in the 45-54 age group at 26% of the workforce, followed by 25% in the 55-64 age group. This means that 51% of our employees are aged 45 to 64, which compares to 29% of the customer population and 33% of the wider LA population. Therefore, our employees tend to be older than our customers; but there’s a similar percentage of customers and employees in the 25 – 34 age group, which is the largest group for our customers.
Ethnicity:
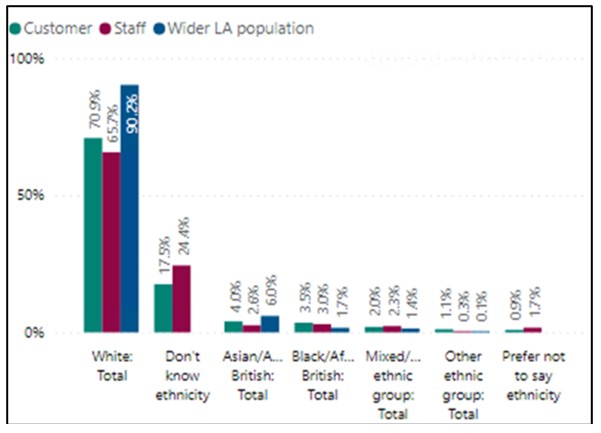
65% of our employees are white, which is consistent with our customer population. The next most common ethnicity amongst our employees is Black/African British at 3% of the workforce, which is consistent with our customer population and higher than the wider LA population.
Religion:
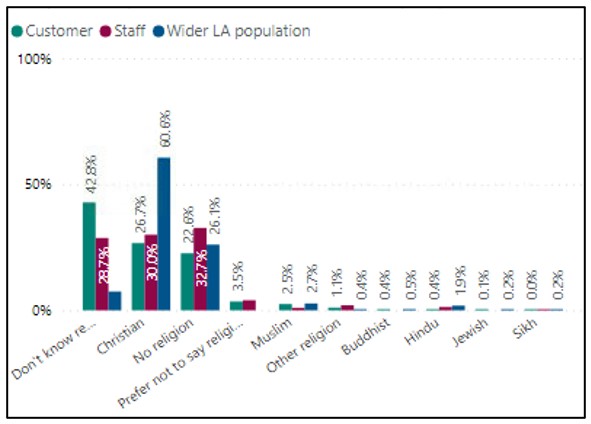
A similar percentage of our customers and staff are Christian (30% and 26%), whilst a higher percentage of employees than customers say they have no religion (32% compared to 22%). The percentage of our customers who are Muslim is 2.5%, which is similar to the wider LA population but greater than the percentage within our workforce.
Sexual Orientation:
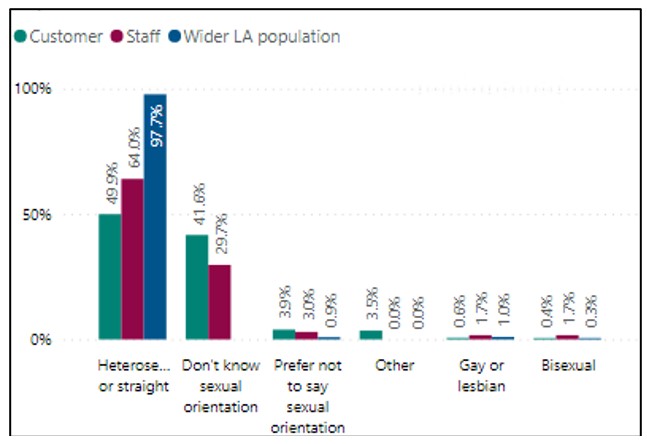
49% of our customers are heterosexual, compared to 64% of our staff. However, for almost half of our customers (41%), we do not have any data. 1.7% of our workforce are Gay or Lesbian and 1.7% are Bisexual; compared to 0.6% and 0.4% of our customers.
Disability:
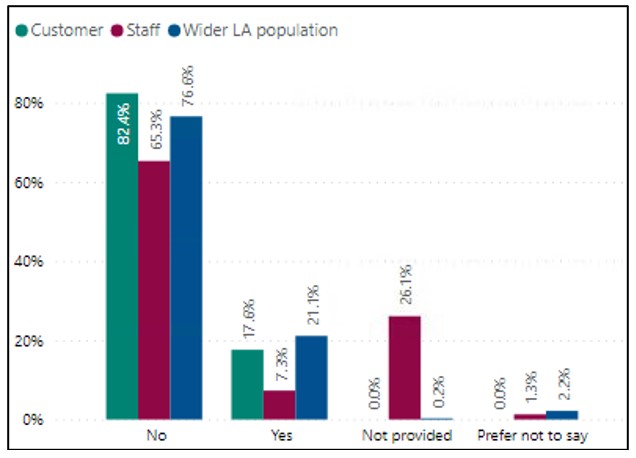
A larger percentage of our customers than our workforce is disabled, with 17% of customers and 7% of employees. This compares to 76% of the wider LA population. However, 26% of our employees are yet to provide us with this data.
For more information or a further explanation of this data, please email people.team@ravenht.org.uk.